
From Data Points to Storylines
Architecting Unshakeable Product Business Cases


Intro
The biggest reason great product ideas die isn’t bad data. It’s good data, told badly.
Every product manager knows the feeling: you’ve got a strong deck, solid metrics, and the business case makes sense — but the room still doesn’t lean in. The problem isn’t that you lack evidence. It’s that evidence alone doesn’t persuade.
This week, we have a guest with us: Hodman Murad, an experienced data scientist and consultant. She has seen firsthand how brilliant product ideas can stall, not because the data wasn’t there, but because the story wasn’t compelling enough.
In her guest post, Hodman shares practical frameworks product managers can borrow from consulting and analytics to sharpen their product narratives, including:
Why dashboards don’t persuade, but stories do
How to structure your argument with frameworks like issue trees and MECE
Ways to connect user metrics directly to business impact
How to anticipate and disarm executive objections
Whether you’re an early-career PM or leading a portfolio, Hodman’s perspective will help you make data work for your story — not against it.
Let’s dive into her insights on building unshakeable product business cases.
Hodman’s Post
As a product manager, you’ve probably been there: you gather every relevant metric, polish the dashboard, and build a deck packed with data, only to watch your proposal stall with executives. The problem isn’t that you don’t have enough evidence. It’s that evidence alone doesn’t persuade. Data convinces when it’s shaped into a story that makes the decision feel inevitable.
Why? Because data alone rarely convinces. It needs a story.
Most product managers think they need more data to win support. In reality, they need a better way to shape the data they already have into a storyline that executives can’t ignore. Consultants don’t show up with prettier dashboards than product managers. They present structured arguments, where every data point contributes to the narrative.
After a decade as a data scientist in consulting and product analytics, I’ve seen brilliant product ideas stall because the data was presented as evidence rather than a narrative. Here’s how to change that.
The Dashboard Fallacy: Why Data Dumps Fail
The first mistake is believing your role is to present data. It’s not. Your role is to recommend a decision.
A dashboard is a repository of facts and figures. A business case is an argument. Executives aren’t looking for more facts; they’re swimming in them. They’re looking for a clear, logical path through the noise that leads to a confident choice.
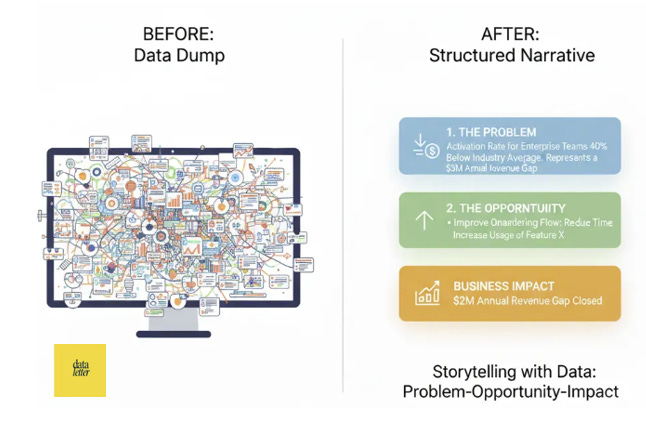
This requires a fundamental reframing: view your data not as a reporting tool, but as a persuasion engine. The critical question evolves from “What does this show?” to “What decision does this compel?”
The Consultant’s Toolkit: Structuring Your Argument
To build your narrative, you need a scaffold. This is where frameworks from management consulting become invaluable. They force clarity and completeness.
1. Start with an Issue Tree
Break your core opportunity or problem down into its parts. If your goal is “Increase Enterprise User Activation,” your issue tree might look like this:
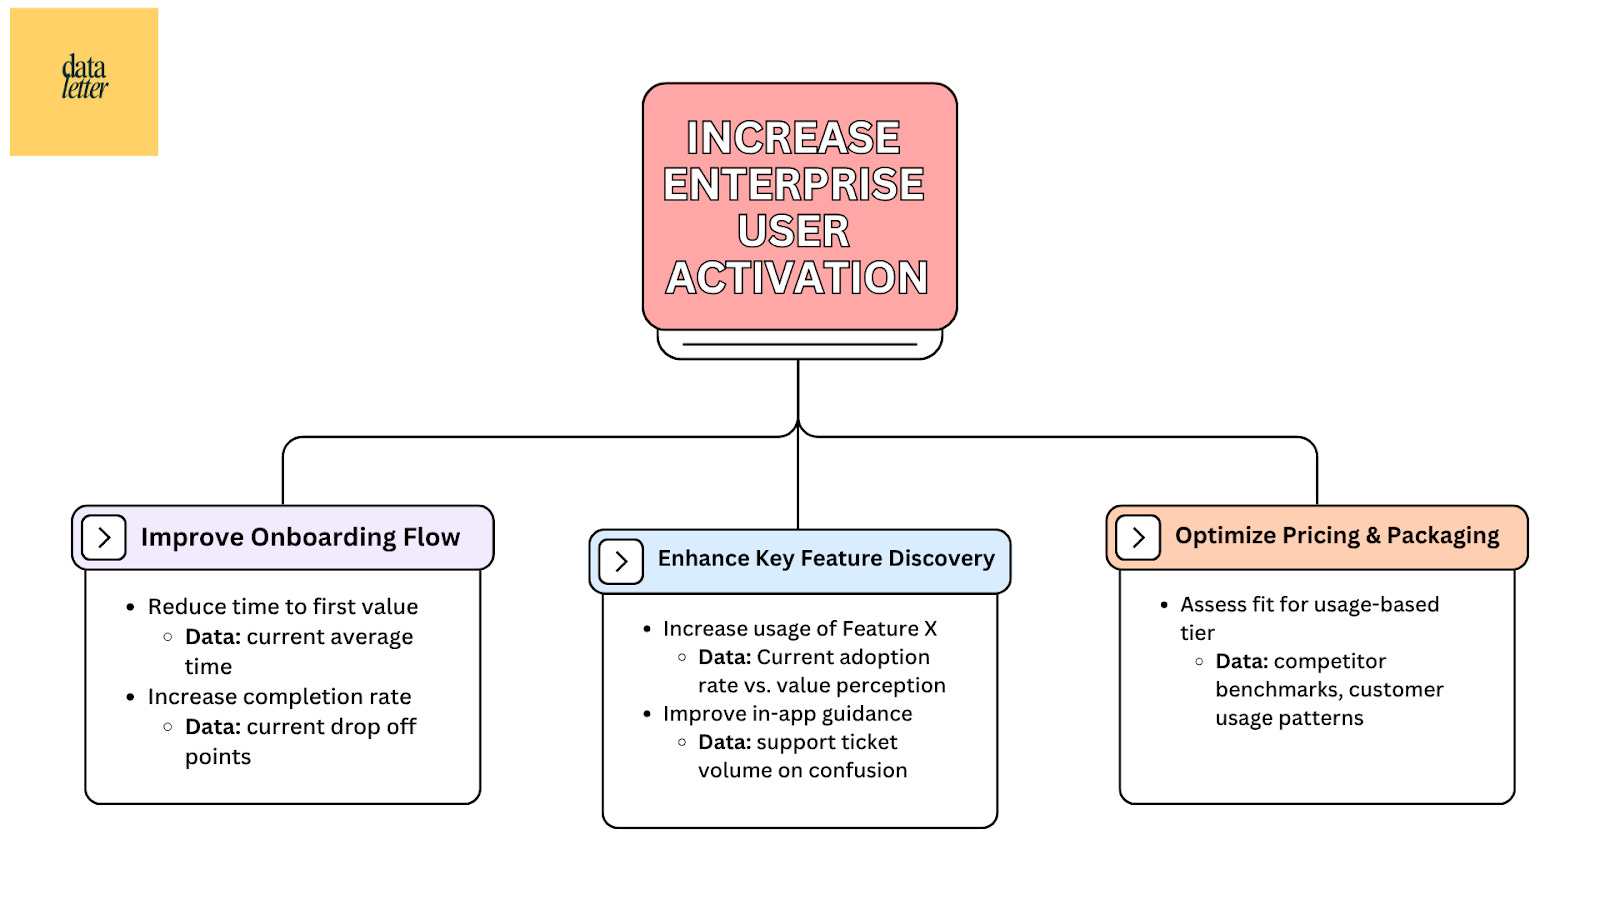
This acts as a logical map that identifies exactly what data points you need to support each branch of your argument. It tells you what to measure and, just as importantly, what to ignore.
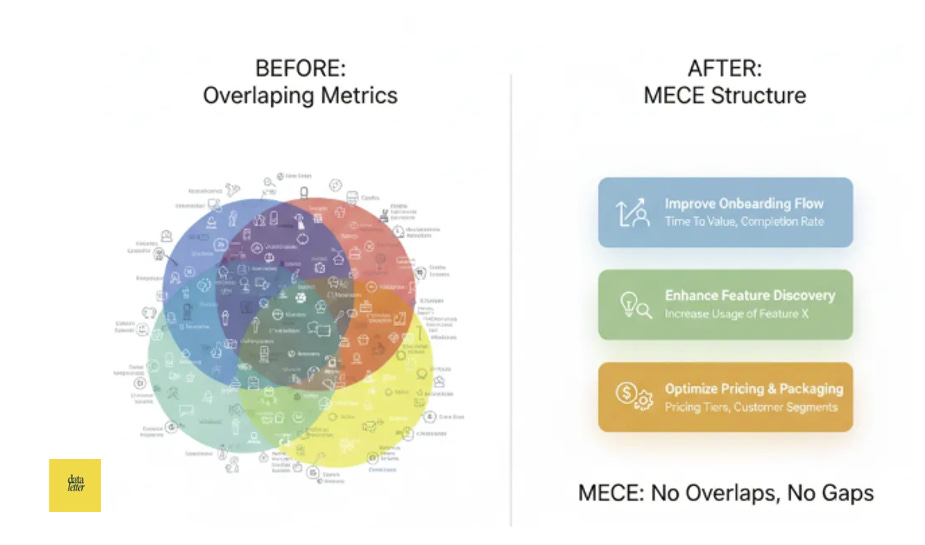
2. Apply the MECE Principle
MECE, or Mutually Exclusive, Collectively Exhaustive, is a fancy way of saying “no overlaps, no gaps.” Your issue tree branches should be distinct, and together, they should cover the core drivers of the problem.
The discipline prevents you from chasing redundant metrics and ensures your argument feels comprehensive, not scattered.
This principle is easier to understand when visualized. Think about the difference between overlapping categories, which confuse, and distinct categories, which cover everything.
Connecting Data to Dollars: The Art of Opportunity Sizing
No matter how innovative your product idea is, it won’t fly unless you connect the data to dollars. This is often the weakest link in a product manager’s narrative: the leap from a user benefit to a business impact.
You don’t need a perfect forecast. You need a credible, data-informed estimate. This is called opportunity sizing.
A Practical Framework: Top Down + Bottom Up
Top-Down: Start with the total addressable market (TAM). If you’re launching a feature for a new segment, what percentage of that segment could you realistically capture? Use industry reports or competitor data to anchor your estimate.
Example: “The SMB project management software market is $5B. Capturing just 0.1% would mean a $5M opportunity.”
Bottom-Up: Use the data you have. If your goal is to improve retention, start with your current user base.
Example: “We have 10,000 users who churn after 30 days. A 5% improvement in retention would keep 500 users, worth $50,000 in monthly recurring revenue.”
Seeing these approaches work together provides strong validation. The funnel visualization below illustrates how independent methods can be combined to verify your estimate.

When your top-down and bottom-up estimates align in scale, they build a compelling, defensible case, transforming a guess into a calculated opportunity.
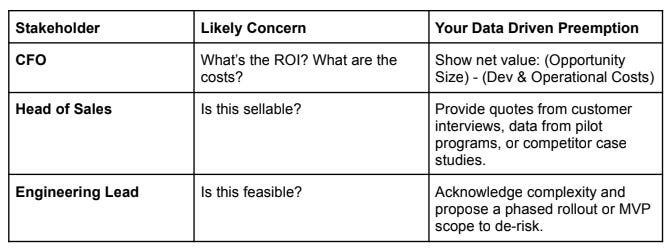
Preempting Objections: Weaving Counterarguments into Your Narrative
A strong narrative anticipates skepticism. Before you present, put yourself in the shoes of your toughest stakeholders.
The CFO will ask about cost and ROI. Don’t just present the opportunity size. Include a rough estimate of the development and operational costs. Show the net value.
The Head of Sales will ask about sellability. Incorporate data from customer interviews or a pilot program that shows clear demand. Reference a competitor’s success to de-risk the concept.
The Engineering Lead will ask about feasibility. Acknowledge technical complexity. Show that you’ve considered a phased rollout or a minimally viable delivery to reduce initial scope.
By addressing these concerns within your narrative, you do the heavy lifting for your audience. You transform potential objections into proof points that demonstrate the depth of your analysis.
Here’s a quick reference for turning common objections into compelling proof points:
A more detailed stakeholder matrix and other practical frameworks are available in the Consultant’s Cheat Sheet.
Architecting the Narrative: A Simple Structure
Now, bring it all together. Your final business case shouldn’t be a chronological report of your findings. It should be a persuasive document.
Start with the Problem: Start with a single, compelling data point that defines the problem. “Our activation rate for enterprise teams is 40% below the industry average, representing a $2M annual revenue gap.”
Build the Argument: Present your issue tree. Walk through the key branches, using your curated data to support why your proposed initiative addresses the root causes.
Quantify the Impact: State the opportunity size, presenting both top-down and bottom-up calculations. This is the payoff.
Defining the Path Forward: Clearly state what you need (resources, budget, approval) and outline the next steps to take. Make the decision easy.
Your Next Step
Before your next major proposal, try this: put your headline metric on a slide. Then, instead of adding ten supporting charts, write three bullet points that tell the story of that number.
What problem does this metric reveal?
What is our hypothesis for solving it?
What is the potential business impact?
You’ll find that this narrative structure forces sharper thinking and leads to more confident decisions, both for you and for your leadership. After all, great product management isn’t just about having the right data; it’s about telling the story that makes the right decision obvious.
Get the Consultant’s Cheat Sheet
The frameworks we’ve covered (issue trees, MECE, opportunity sizing, and stakeholder mapping) are even more powerful when you have them at your fingertips. I’ve condensed these tools into a single page Consultant’s Cheat Sheet that you can reference during your next business case preparation.
🙏Thank you to Hodman
Thank you to Hodman for sharing her insights on storytelling with data.
Hodman Murad is a data scientist who connects raw analytics with executive decision-making. With a background in consulting and in product analytics, she specializes in turning complex data into clear, actionable business cases.
She writes The Data Letter, a Substack that provides practical toolkits for data practitioners and their senior leadership teams, built on a decade of experience cleaning up data disasters. Her work is dedicated to helping professionals make confident decisions, avoid costly mistakes, and deliver real business impact.
Subscribe to The Data Letter for your free Data Reliability Audit Kit and get in touch with her here.

Relevant paid articles from Hodman:
Connect with Amy on LinkedIn, Threads, Instagram, and Bluesky for product management insights daily.
 | A guest post by
|
Really appreciate the breakdown of turning data into persuasive narratives. As someone who just graduated and is tackling a code documentation tool, I’d love some specific advice for figuring out what stories to prioritize. Would you be willing to talk or answer a few more specific questions? hjconstas@docforge.net
Folks always miss the story.